Structuring the EV Charging Management System for Efficiency and Scalability
Turning an undocumented complex system into one a team can build, test and grow
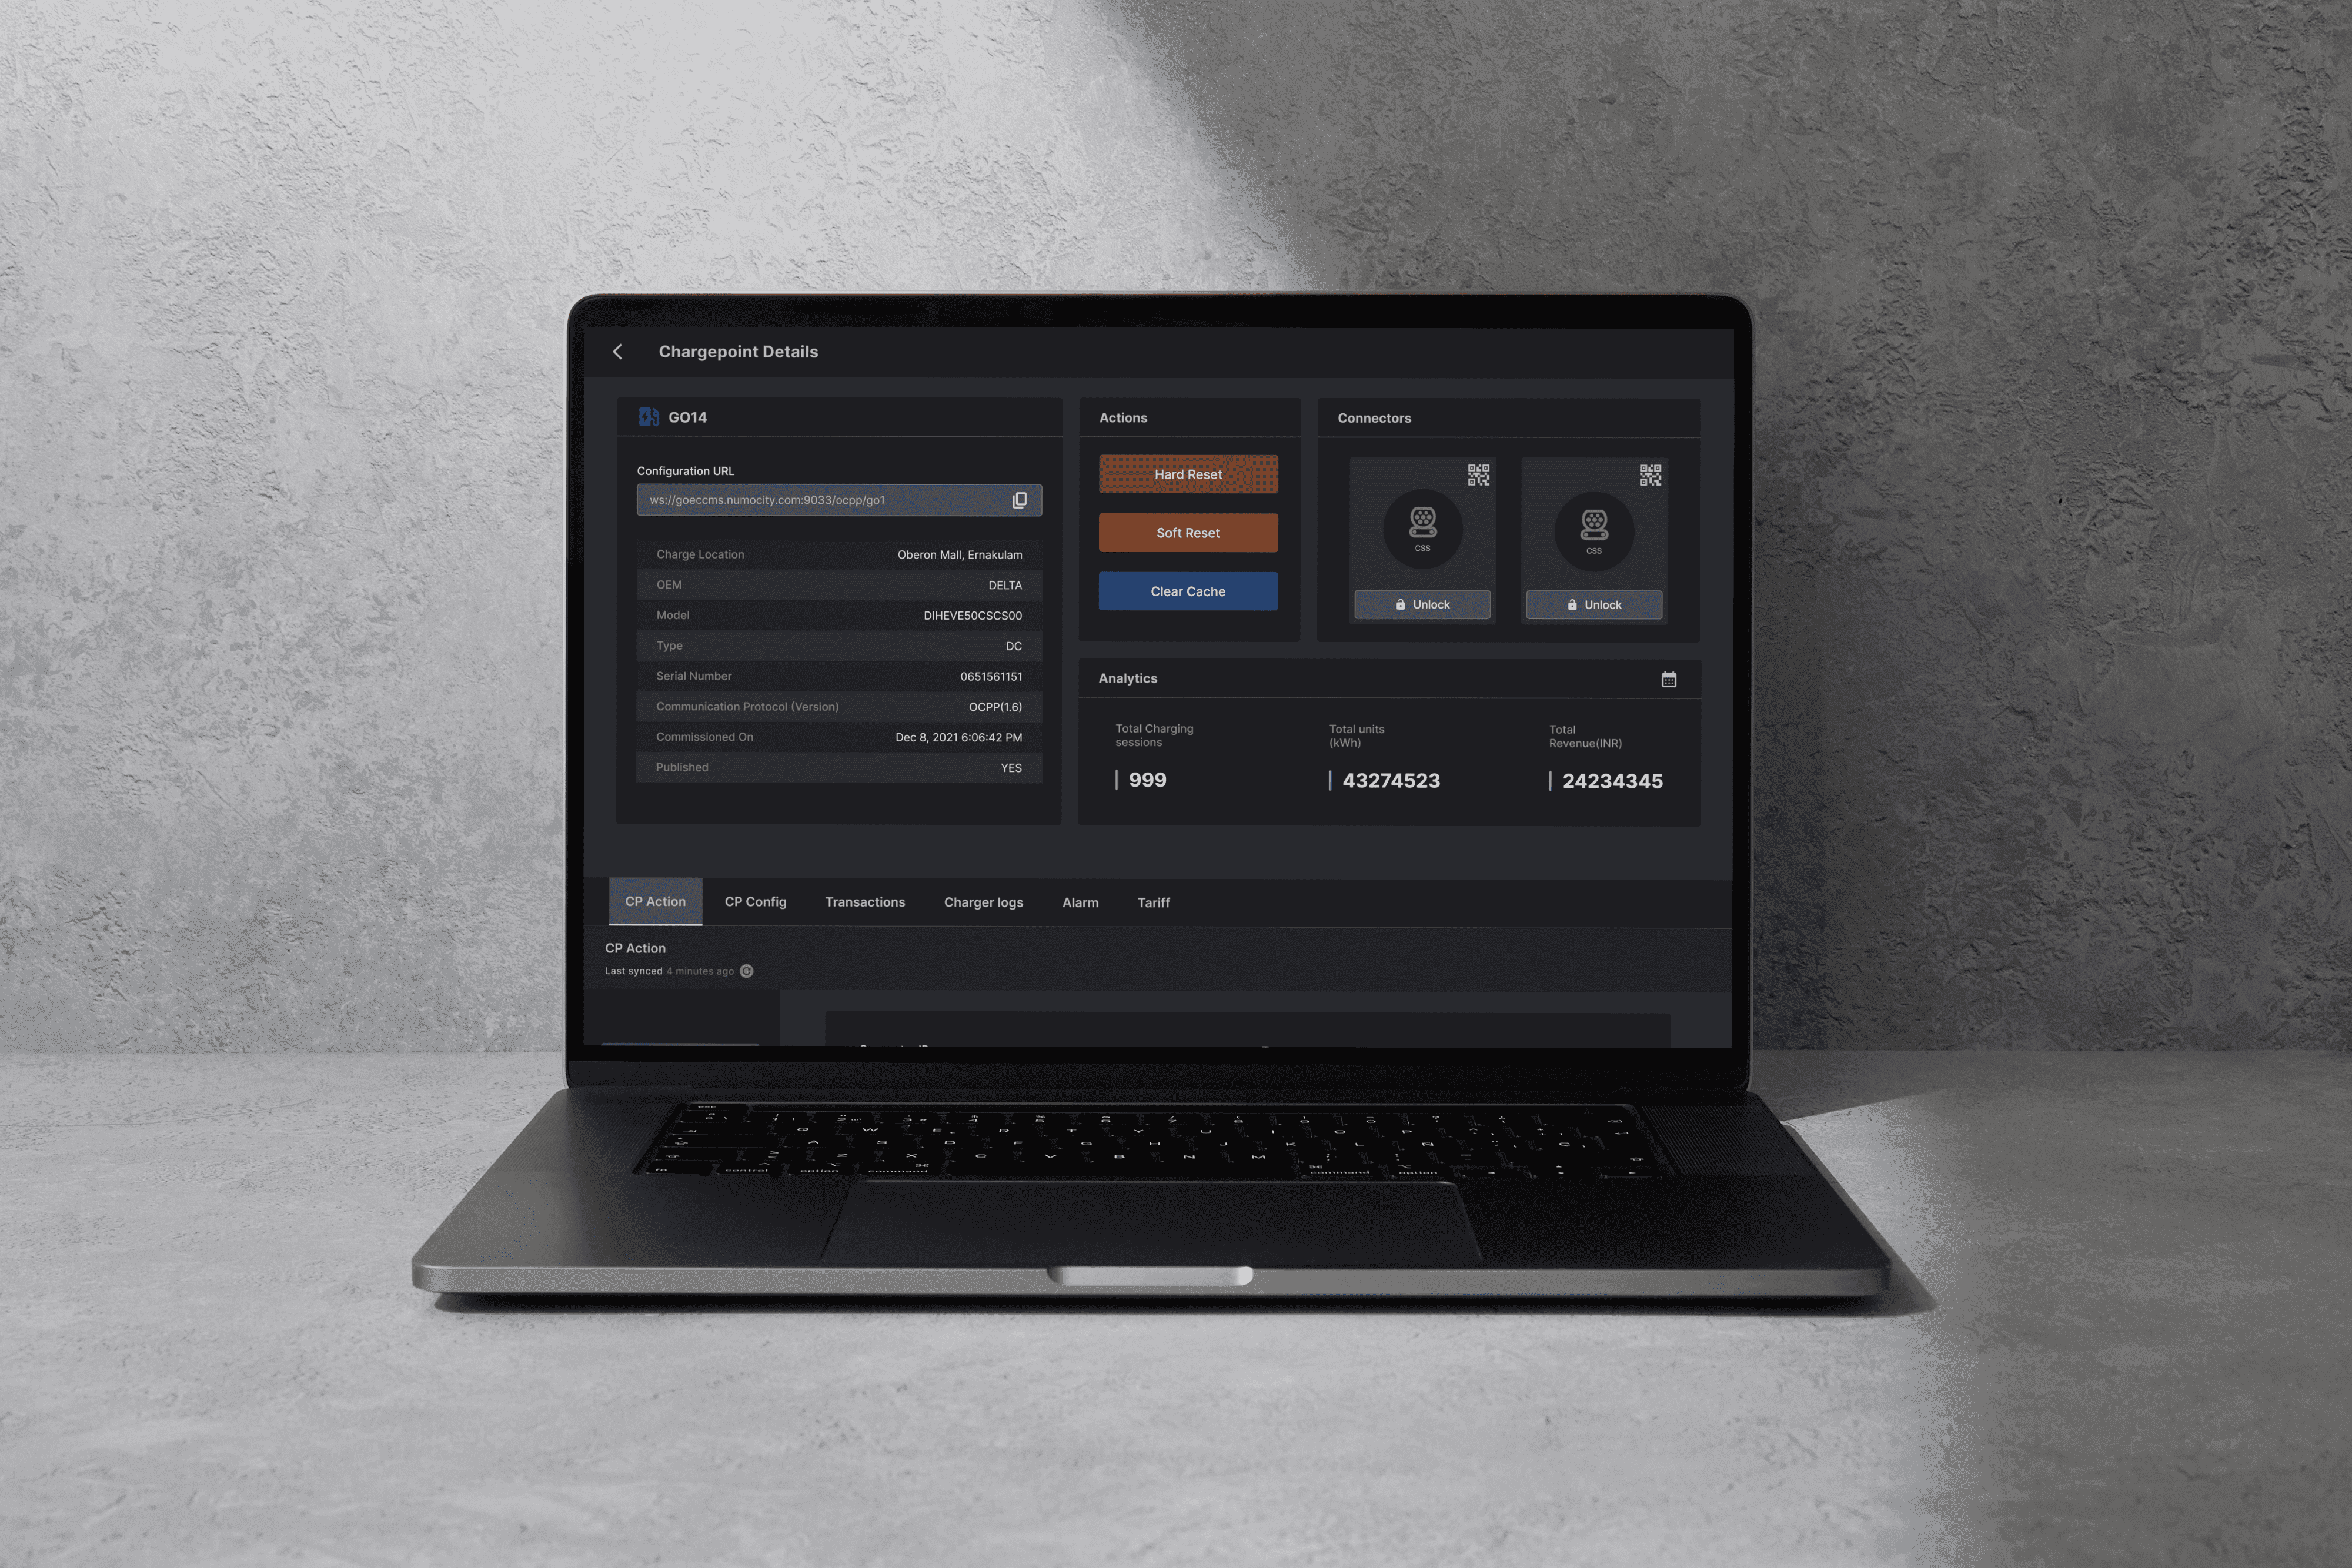
Role
Product Designer · Systems & IA
Software used
Notion, Figma, Jira
Duration
6 months
Who uses it
Who | Needs | Pain point |
|---|---|---|
GOEC's tech team (they run the system) | To find a record, check it and act on it fast | Too many clicks to see details, and it's hard to find things in long tables |
The development team (they build from my documentation) | One place that explains how everything works | Specs and interactions that weren't clear |
Principles that guided the work
Understand before designing. I reverse-engineered the system and cross-checked it against the screens already in use.
Structure first, polish second. I settled the information architecture and checked the flows for errors before spending time on visual detail.
Document every screen as I go. I documented screen by screen and refined along the way, because writing things down exposed gaps.
What the decisions are based on
There was no research phase and no documentation to start from, so the decisions came from how the system was actually used and tested.
Reverse-engineering the system: every entity, function and dependency, cross-checked against the screens already in use.
Flow checks after the information architecture, to catch errors before visual detail.
Real charging sessions at night: the team ran the live system and took an EV out to charge it. Responses and errors were recorded in real time and passed on to me.
Testing alongside development: usability testing and issue tracking in Jira, so feedback from the old system in daily use shaped the design as it changed.
My Role
I worked with GOEC's tech team, the development team and PMs. I owned four things: reverse-engineering and documenting the system, restructuring the information architecture, fixing UI inconsistencies, and testing once development started.
My First Challenge – Understanding the System
There was no documentation, so I started by breaking the system into entities, functions and dependencies, then checked each one against the screens the team already used.
How the system works?

Deep-dive into the process


That exposed flaws no one had written down. In Asset Management, for example, every charge point belongs to a charge station, but people reach them from either end. I kept two lists for easy access and linked them both ways: a station's page lists its charge points, and a charge point's page shows its station. Each keeps its own functions, so the flow works from either end.
Documentation
Due to its complex terminology, a detailed description of the design was necessary to communicate with the developers and the team. Every screen and its flow was explained in detail. Below are the snippets of the complete documentation of the project done in notion. Developers worked from IA maps, flowcharts and screen-by-screen documentation, which cut questions during handoff.

Design refinements


Decision | Why | What it cost |
|---|---|---|
Hover-triggered scrollable content instead of "click to view" | The tech team checks many records a day, so each extra click adds up | Hover needs a fallback for touch screens |
Table rows clickable directly | Removes the extra step to open a record | Rows need a clear hover state so people know they can be clicked |
Popups that bring details up front | Avoids deep navigation and lets people stay in the list | Too much in a popup gets crowded, so only key details go in |
Letter-based search with instant table filtering | Long tables were hard to scan | Needs a fast response, so I agreed it with developers |
Separate station and point lists, linked both ways | Easier to scan and reach from either end | Both pages must stay consistent |
Testing

The testing process was conducted using Jira to track issues and manage the workflow. I was responsible for:
Identifying Bugs: Systematically identifying and documenting bugs in every section of the product. this was done by using JAM for bug reporting.
Issue Tracking: Follow up on bug fixes, ensuring that all identified issues were resolved before the system's release.
Regression Testing: Conducting regression tests to verify that recent updates and bug fixes did not negatively impact existing functionalities.
User Acceptance Testing (UAT): Collaborating with stakeholders to conduct UAT, ensuring the system met user requirements and was ready for deployment.

Results
Quantifiable Impact
Area | Problem | Action taken | Outcome |
|---|---|---|---|
Bug Identification | System had numerous undetected bugs and functional gaps | Identified and documented 60+ issues during testing, design reviews, and internal QA | Achieved 90% resolution rate, improving product stability |
UX Flow Issues | Many flows were unintuitive or had too many steps | Suggested and implemented UX flow improvements, cutting steps from 4 to 1–2 in key areas like table details | Increased usability, reduced task friction |
Search Improvements | Users had difficulty finding content in tables | Introduced predictive search with live keyword filtering and result display | Easier navigation, faster access to relevant data |
Signals to watch
To know whether the redesign keeps working, I'd track clicks to reach a record's details, time to find a record, questions developers send back about specs, and how many bugs reopen after a fix.
Reflection
I'd test with GOEC's tech team earlier, instead of mostly after development began. I'd also measure a baseline before changing anything, so the improvements can be shown with numbers rather than described.

Click on the above image to view the Web App developed
Other projects
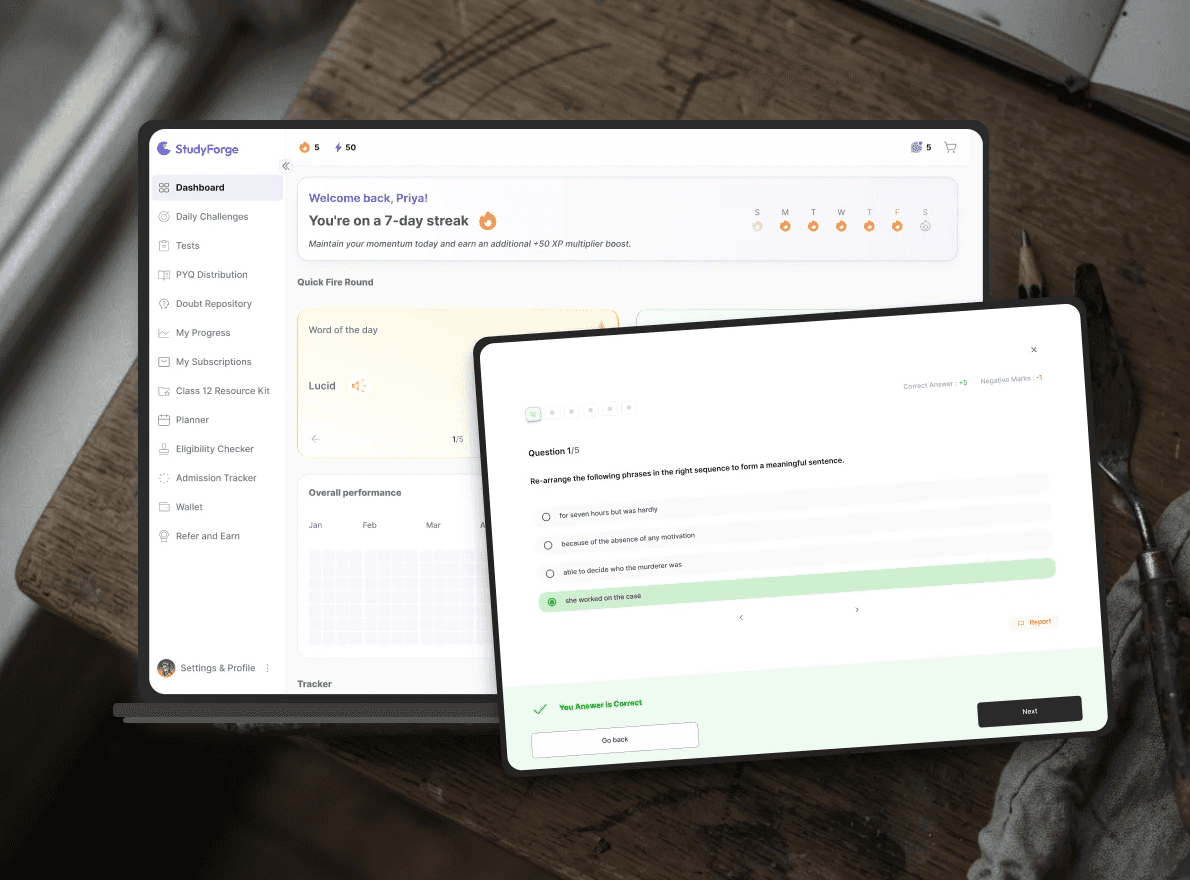
Designing the Multi-Entity EdTech Platform for Exam Prep and College Decisions
Preparation, performance insight, and college decisions, in one connected system

Revamping the EV Charging Experience: User App Redesign
Transforming the EV charging app interface for a smoother user experience.

Electric Fleet Management
Foundational work on Oxium Energy’s Fleet Management Solution

Community App for college alumni
Community management dashboard and app for a Middle East-based college alumni network.
