Designing the Multi-Entity EdTech Platform for Exam Prep and College Decisions
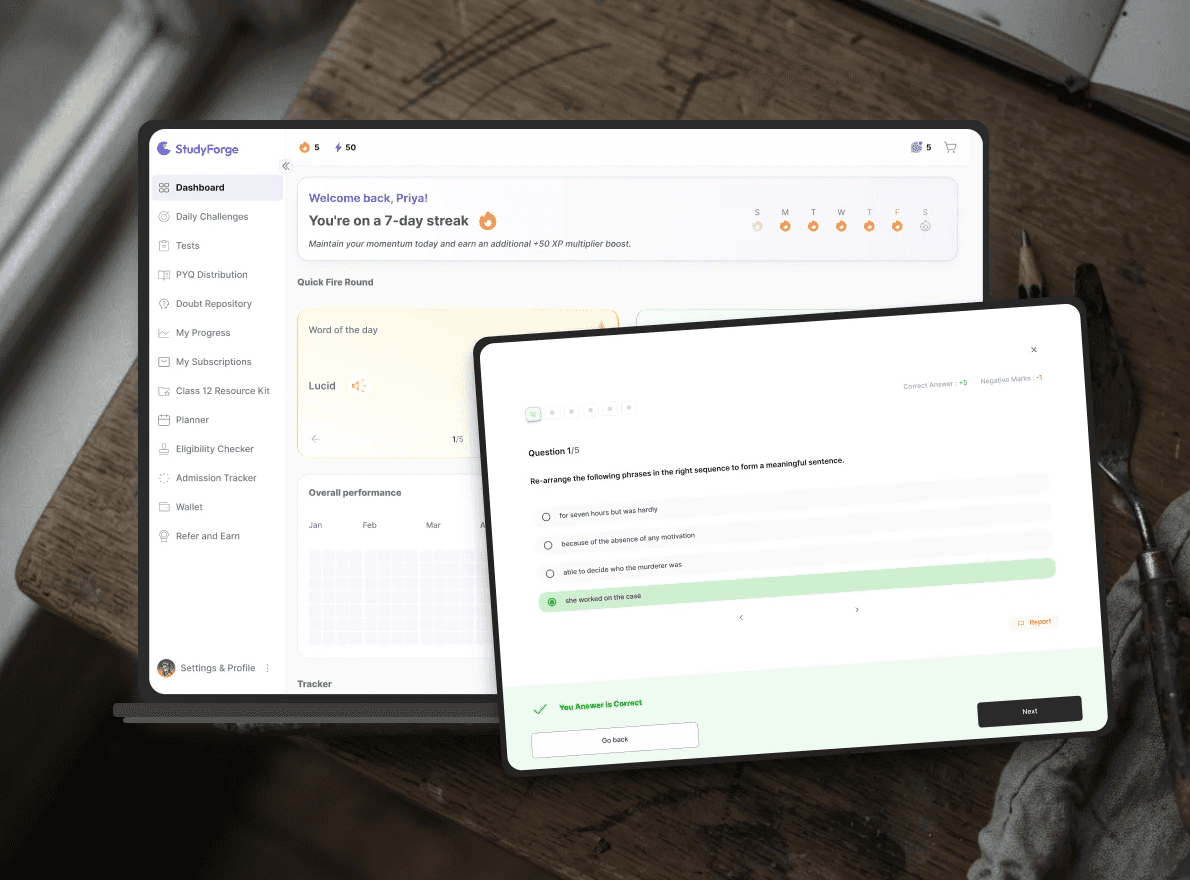
Preparation, performance insight, and college decisions, in one connected system
Role
Lead Designer working with the founders, a dev team and a junior designer
Software used
Figma . FigJam . Notion . Jira
Duration
1 year, Ongoing

The system
Five roles: Student, Teacher, Mentor, Parent, and Admin ; each with a different slice of the same underlying system.

Open Questions

Who needs what
Role | Needs | Pain Point |
|---|---|---|
Student | Improve , then choose the right course | Anxiety about time; unclear what to fix next |
Parent | Stay Informed | Visibility without turning into surveillance |
Teacher | Author accurate test content efficiently and clear doubts | Need real tools, not a content dump |
Mentor | Guide specific students | Oversight without micromanaging |
Admin | Make sure the platform runs smoothly | Needs context rather than a full CRM |
Principles that guided every decision
'Improvements area', not 'you are bad at this'
Clarity over volume
Role-appropriate density
What the decisions are based on
There are no usage numbers yet, so here is what I did have.
The founders went through the Exam(Common University Entrance Test,CUET) process themselves, so the problem was first-hand.
An earlier MVP of the product ran last year. It showed the need was real, for both students and academics.
The designed and built screens were tested with real users: Delhi University admin teams, teachers, mentors and students. All gave a positive response. That's as far as we could take testing before launch.
I got data on where students got confused while reviewing their results, which is how I decided what to show first and what to put a tap deeper.
What I can't show yet is measured impact. That will come once the student platform launches.
System Architecture
The product as a whole is about one stream of practice data, summarised differently for five different audiences.
Student: practises on the platform’s own mocks and tests, sorted by topic and sub-topic. No teacher needed to start.
Teacher: a school, tuition centre or institute. Forms a cohort with its students and adds its own material on top of the platform’s.
Eligibility check: before or after the exam, a student enters class 12 marks (and later the exam result) to see eligible courses, dates and application steps. It also gives an estimate: reach this practice score and you’d be eligible for these courses.
Mentor: a former student who guides exam prep and application decisions.
Parent: a read-only view of tests and performance.
Admin: runs the platform underneath.

Designing depth that a stressed 17-year-old can actually read
A student's path to this point is simple: log in once, land on a dashboard with a handful of other tools alongside it, pick a test format, take it, and arrive at results.
A Mini User Flow is shown below:


The harder part wasn't deciding what to include.It was resisting to show all of it at once.
Challenge: Too much data, and no clear way to lay it out.
The client's brief carried an extensive list of parameters to show a student where they stood. Given an NDA, I can't name the list itself.
The real design work wasn't building a dashboard for all of it. It was deciding what actually earned a place in front of a student, and what was just noise.
That filtering came from watching the actual frustration and confusion students hit while reviewing results, not just for the sake of cutting it short.
The choice of representation whether a chart, a graph, or a simpler stat, had to make dense information feel approachable rather than clinical to someone reading it under exam-pressure stress.
Solution: Content Layering


Each metric got an in-depth chart or stat form designed to feel readable, not overwhelming.
Tap it, see the detail, close it. Nothing forces a student to look further than they want to.
Comparison is off by default : seeing your own score is one thing, seeing it beside a topper's is a different kind of pressure.
Outcome: Not yet measured, because the student platform is still in development. The first signals I'll look at once students are using it;
Do they open Layer 2 after a test, or stop at the score?
Do they switch Compare on?
If most stop at Layer 1, the layering is working. If nobody opens Layer 2, the depth I fought to keep isn't earning its place.
Do they click on Information icon a lot? If yes, representations and depictions need to be clear enough.

This section is still being iterated and tested against the full range of student flows.
Building the one place that replaces ten browser tabs

The real challenge was trust, not mechanics: the module is only useful if it's more reliable than piecing information together yourself.
Challenge: No existing pattern, and no room for a wrong answer.
The real design work was building something reliable enough that a student would stop opening those other tabs.
There was no existing pattern to borrow from, inside the product or outside it. This was genuine zero-to-one territory, worked out through judgment rather than precedent.
Students can go from browsing colleges to a personalised roadmap; with the right information in the right order.
Solution: The entry point is basic info and a class 12 percentage, with no test data required. Performance data sharpens the picture once it exists, but it's never the gate.
The flow replaced a simple "search, then see a result" with a connected sequence:
Search a college → See what backs it → Check eligibility, Timeline and process → Save a choice as a goal → Get a concrete roadmap.


Expected outcomes and signals to watch
Whether students with no test history complete the flow. That is the case the redesign was built for.
Is the data elaborate enough?
The other roles, briefly
Parent Dashboard
The brief is explicit that parent dashboard is read-only and not a mirror of the student's account.
The design challenge was building a genuinely useful first-read screen without making it a monitory-level detail. A deliberate call to keep a support feature from quietly becoming surveillance.
Kept on the Dashboard | Left for deeper student activity page |
|---|---|
One score/percentile + a trend word (" Improving", "Steady") | Full Subject wise score table |
Last 3 Test scores + Trends | Per Question detail of tests |
No Goal setting | |
Leaderboard/ Platform Ranking |
Teacher Dashboard
Teacher gets the content behind the practice .Building and managing the question banks, tests, and chapter tags that feed the student practice loop, reusing the platform's own test-authoring flow rather than building a second one. The discipline here was to keep platform-provided and teacher-provided content clearly separated even though both run through the same pipeline.
Mentor Dashboard
Mentor gets a light read of a student's recent performance, not the full dashboard. Just enough to start a conversation. Add a chat and call channel, and a place to log notes .That's the whole tool. The team kept it light on purpose, and had to defend that choice more than once against the instinct to build more.
What I'd do differently
If I started the 0→1 phase again, I'd do more research up front and build in stages: ship a module, watch how students use it, and let that shape the next one, instead of designing a five-role system on assumptions. The team has direct access to incoming students, so that loop is available, not theoretical.
What this project really taught me
Ground every decision in what exists. Screens started from a real flow wherever one existed.A messy existing flow beats a clean guess every time.
Name the scope creep. When something got bigger than it should, that got said out loud, not absorbed quietly.More than once, the answer was to cut it down or push it to the next phase, not force it through in one pass.Staying quiet about it just means building the wrong thing well.
Protect a single source of truth. One performance signal, summarised differently per role, never duplicated .No two views can drift apart.
Let the emotional register do real work.It shaped which data appeared at all.Tone isn't just wording. It decides what a stressed user even gets to see.
How the product earns, and what I'm watching
The product earns by selling mock tests.
What makes a mock worth buying is the in-depth performance analysis, which is the real selling point. So the plan is to launch with a free plan that comes with credits. Students try the analysis, see the value, and then buy more.
The number that tells us whether it's working is how many free users go on to buy. I can't answer that yet, because the student platform hasn't launched. It's the question I'll keep following, on this product or the next.
Other projects

Revamping the EV Charging Experience: User App Redesign
Transforming the EV charging app interface for a smoother user experience.

Electric Fleet Management
Foundational work on Oxium Energy’s Fleet Management Solution
Structuring the EV Charging Management System for Efficiency and Scalability
Uncovering Issues and Enhancing UX

Community App for college alumni
Community management dashboard and app for a Middle East-based college alumni network.
